
Background
ClearCalcs calculates in real time for instant results. When designing a steel beam to ASD or LRFD, three conditions must be checked for adequate design: bending strength, shear strength, and deflection. This article will outline how to interpret your ClearCalcs results and determine ways to optimize results. This will allow for more efficient and cost-effective designs.
If you'd prefer to follow along with the video, check out the video here.
Summary
Moment Utilization
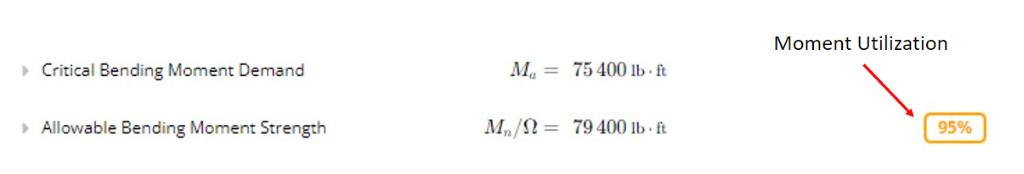
What is moment utilization?
Moment utilization is the ratio of adjusted bending moment strength to the critical bending moment demand. Moment capacity represents the maximum bending that the beam can resist without excessively deflecting and failing.
How is moment calculated?
Moment strength for a plastic section is calculated by multiplying the plastic section modulus by the yield strength. For sections where the longest unbraced length is less than the elastic global buckling length, a different equation is used to calculate moment strength. This case considers a moment modification factor, Cb, and the unbraced and global buckling length. The moment strength also considers cases in which lateral torsional buckling is critical and a lower strength is provided.
If you need to decrease your moment utilization, here are 3 factors that you could modify:
1. Use a larger steel cross section with a larger depth or width. Consider using a W12x96 instead of a W12x45 for a higher moment strength. This increases the plastic section modulus, since it is determined using the cross-sectional geometry. 2. Add more support or bracing to prevent lateral torsional buckling. For example, members restrained continuously by other members will prevent rotation and additional loads applied away from the member’s longitudinal axis. If you have a beam 14 ft long and you add additional support at the midspan of 7 ft, there will be a lower governing load demand for the same supporting capacity. 3. Use a steel beam with a higher yield strength. This material property determines when the member starts to deform. By using a higher grade steel, it will allow the beam to support higher loads without bending as much.
Shear Utilization
What is shear utilization?
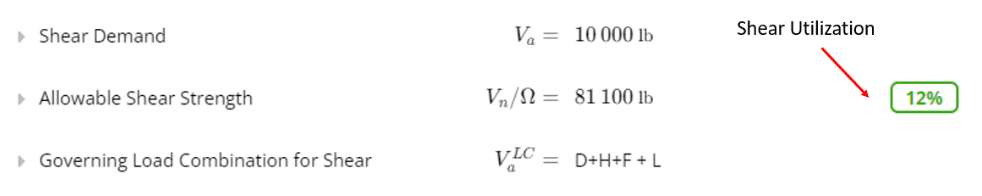
Similar to moment utilization, the shear utilization is the ratio of factored shear capacity to governing shear demand. Shear capacity represents the maximum shear force that can be supported before shear deformation or failure occurs.
How is shear calculated?
Shear capacity considers the yield strength of the beam, as well as the web area and a web shear strength buckling coefficient. The coefficient accounts for the effects of shear buckling in stiffened elements, such as the webs.
If you need to decrease your shear utilization, here are 2 factors that you could modify:
1. Use a beam with a higher yield strength. Shear yield stress is taken as 60% of the tensile yield stress, by increasing this value the beam’s shear strength will increase as well. 2. Increase the web area. Most of the shear strength is provided by the web of a W-section in comparison to the flange. For example, if you have a W12x40 with a high shear utilization, consider using a W12x45 where the web thickness is 0.575 in instead of 0.515 in.
Critical Deflection
What is critical deflection?
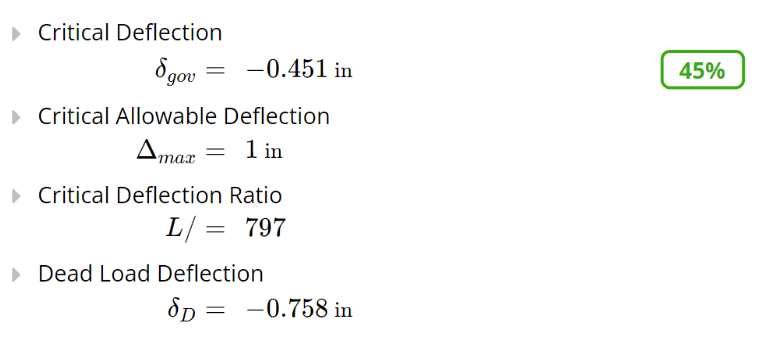
Critical deflection is the governing maximum deflection along the beam. This is determined from serviceability load combinations, only considering first-order effects. Short term serviceability loads include live, snow, wind, earthquake or roof live loads.
How is critical deflection calculated?
Critical deflection is calculated for each span individually as the maximum from each serviceability load combination. Longer spans have higher allowable deflection, so shorter spans may govern with a higher utilization. For cantilevers, the allowable deflection is taken as twice the simple span deflection per the IBC. This value is determined considering the loading conditions and beam properties, typically using a deflection equation. Dead load deflection is calculated separately at any point in the beam, which may be used for cambering.
Diagrams
Graphed Load Combination
How to change the graphed load combination
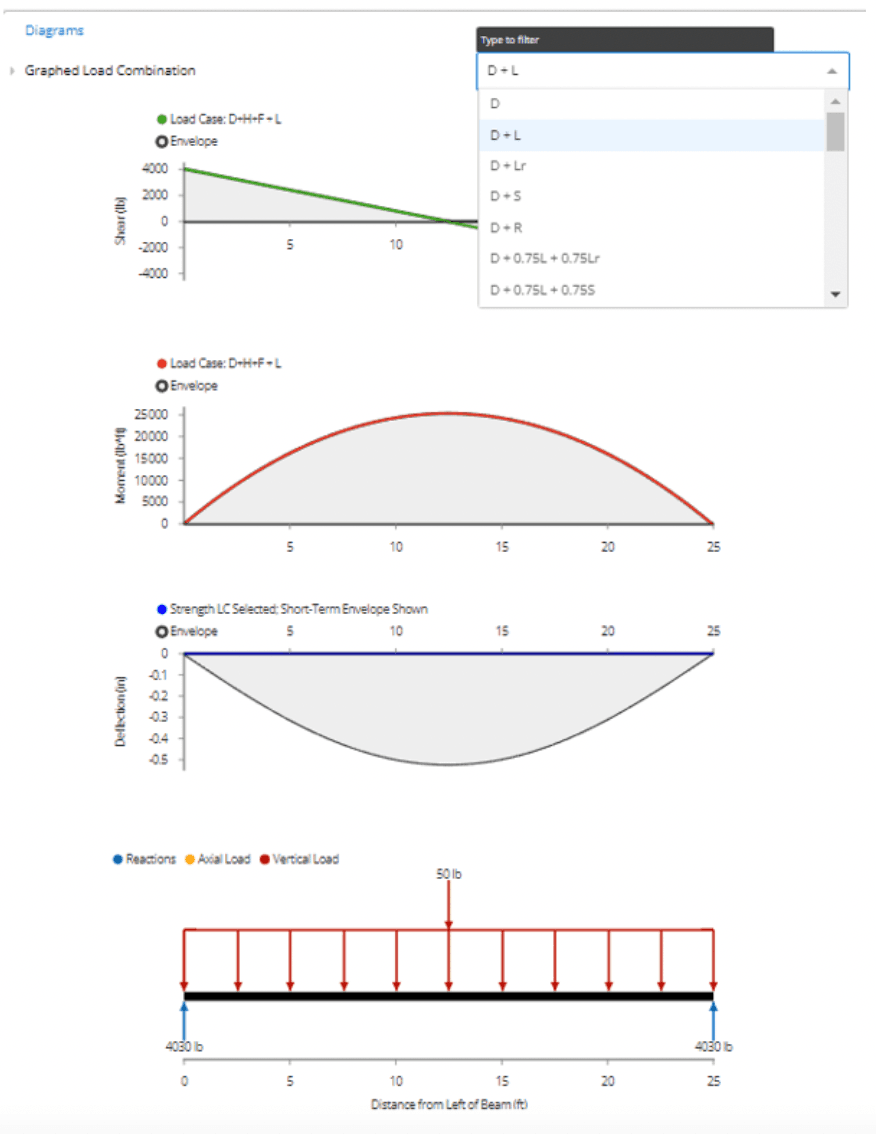
The graphed load combination can be changed by selecting the preferred combination in the drop-down list at the top of the “Diagrams” section. By default, ClearCalcs graphs the “D+L”, or dead + live load combination.
How to determine the governing load combination for my beam design
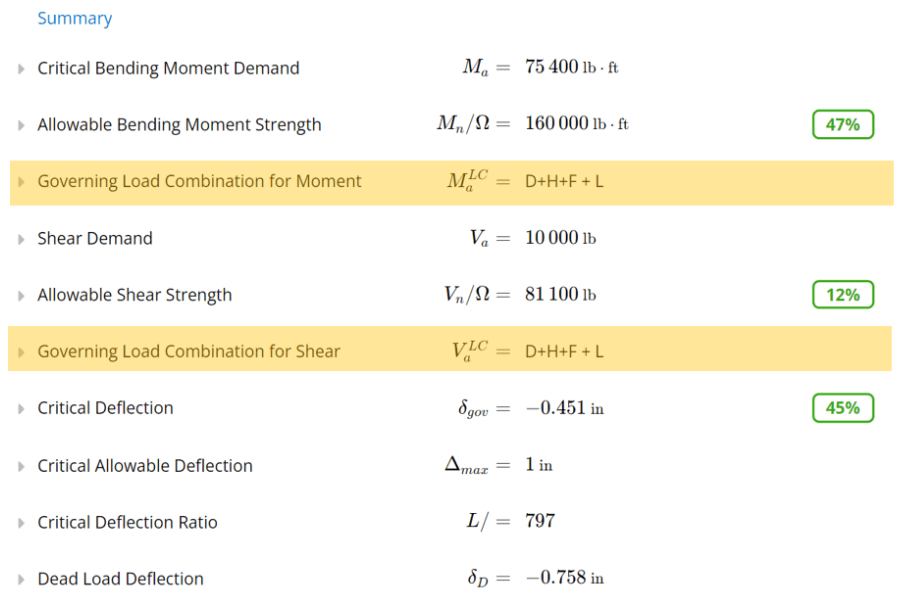
The governing load combination for beam design will be the one associated with each of the maximum utilization ratio. You can view the governing loads in ClearCalcs under the summary section, as shown below
Shear Diagram
What is a shear force diagram?
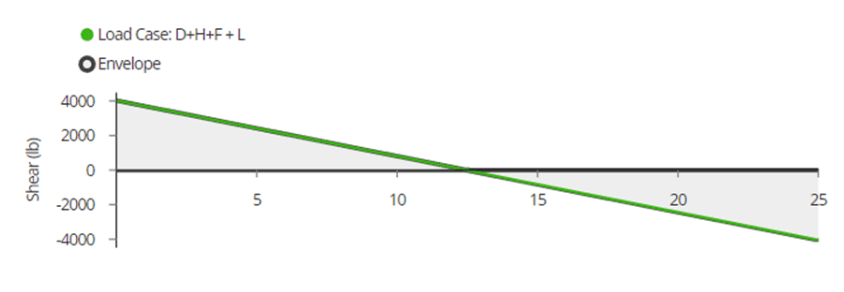
A shear force diagram is a visual way of identifying the shear force distribution over the length of the member. To interpret your shear force diagram, any given point will show the location along the beam (x-axis) and the shear force (y-axis). This represents the internal stress the wood beam experiences due to the applied loads.
Moment Diagram
What is a moment diagram?
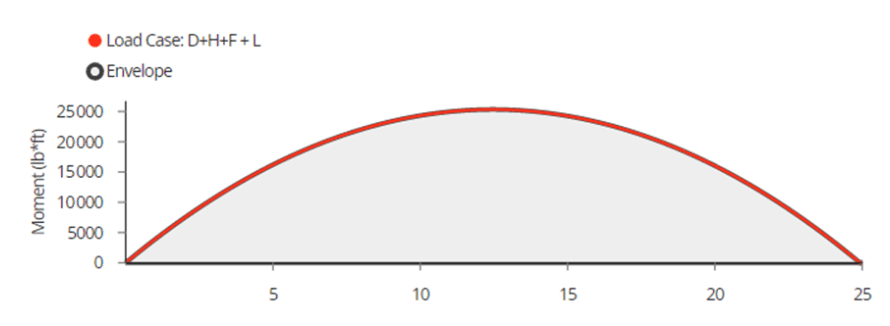
A moment diagram is a graphed distribution of moment capacity along the length of the member. To interpret your moment diagram, any given point will show the location along the beam (x-axis) and the moment capacity (y-axis). This represents the rotational forces that will occur due to exterior applied loads, any distance away from the point of interest. This bending moment value is calculated and plotted at each location along the beam.
Deflection Diagram
What is a deflection diagram?
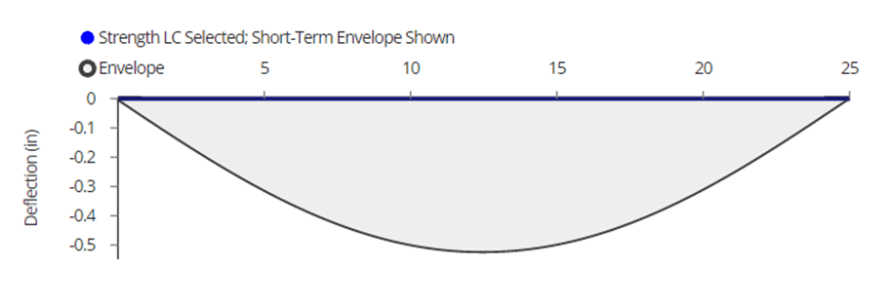
A deflection diagram shows how much the beam will deflect at any given point along the length of the member. To interpret your deflection diagram, each point will show the location along the beam (x-axis) and the maximum deflection (y-axis). This represents the distance at which the beam will deform due to exterior applied loads.
Free Body Diagram
What is a free body diagram?
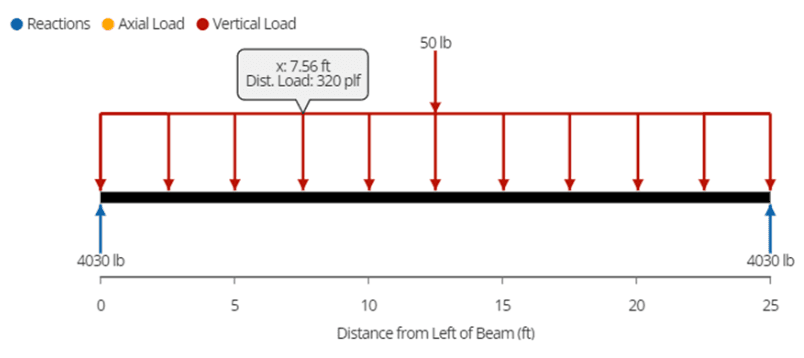
A free body diagram (FBD) is a visual diagram showing the magnitude and direction of all forces acting on an object. In ClearCalcs, the forces you may expect to see on the diagram include distributed, line, point and moment loads, axial loads, and support reactions. More detailed information about loads at a specific location can be found by hovering your cursor over the free body diagram.
To interpret your free body diagram, you can identify the member you are analyzing (in this case, the wood beam), as well as the magnitude, direction, and location of all forces. For example, in the following image, we have a 50 lb point load acting downwards at a location of 12.5 ft from the left edge of the beam.
.png)
